
We are embarrassed to admit that we haven’t run any events since the last OKC Memorial Marathon. T3, Mav and Weeble trained (if you can call it that) and ran this year.
The start of the races was delayed nearly two hours by severe weather. With a line of thunderstorms producing lightning, hail and high winds approaching the Oklahoma City area as the 6:30 a.m. start neared, race officials decided to push back the start 30 minutes. Several more delays followed as the weather lingered. The Pirañas hung out in the 5th Street Parking Garage to stay out of the rain while waiting for the start. The weather actually pushed the race dangerously close to being canceled. Race officials have a policy of starting by 8 a.m. That is to avoid the heat of the day, when runner safety could be put at risk, and because road closures for the race could only be maintained by the city for so long.
Pirañas at the start: 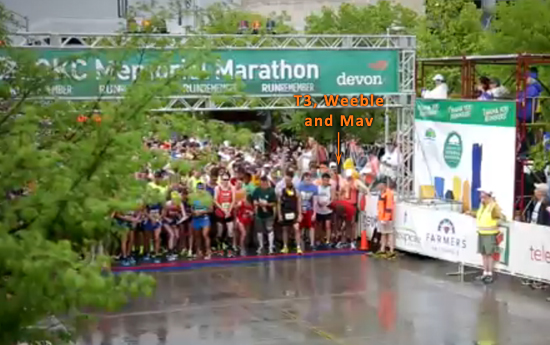
Run Pirañas Run 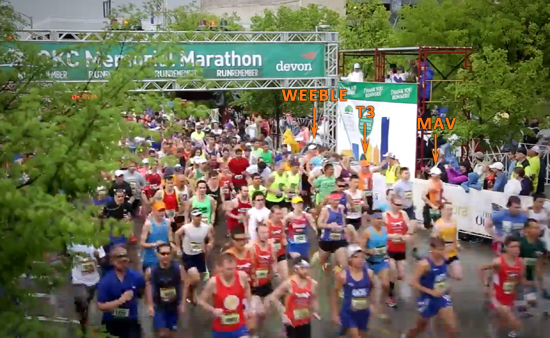
As the race wore on it quickly became evident that this was not going to be a great day for the Pirañas. Weeble moved out in front running with friend and training partner Jim while Mav and T3 tried to settle into a rhythm which never came. The boys saw many friends along the way and T3 was his usual friendly self, running up into lawns and sitting in people’s chairs and taking food and libation from new found friends. Beer, Mimosa’s, Bacon, a shot of Vodka…all found within a 26.2 mile long block party.
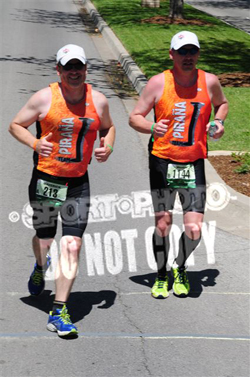
Between 8 & 9: Weeble and Jim, Mav and T3
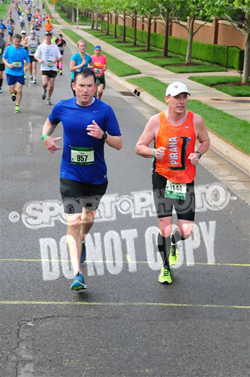
By Lake Hefner Mav was struggling and T3, with head down and focused on making the bridge, dropped him unintentionally. T3 caught Weeble who was slowing down, then went on. Mav almost quit at the Lake after T3 left him (T3 was very sorry about that), but Mav has never quit anything, so on he went eventually catching Weeble.
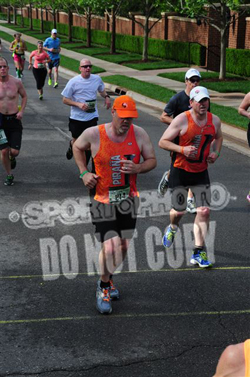
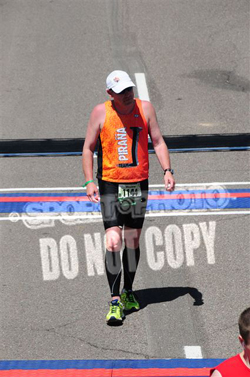
Mav and Weeble around mile 24
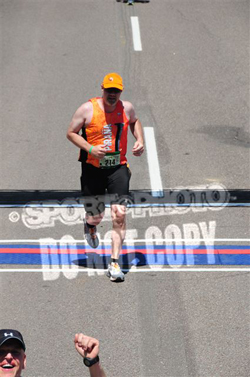
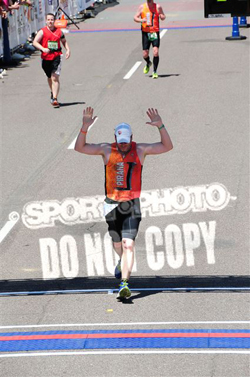
Finally the day was over: T3 in 5:18, Mav and Weeble in 5:58:
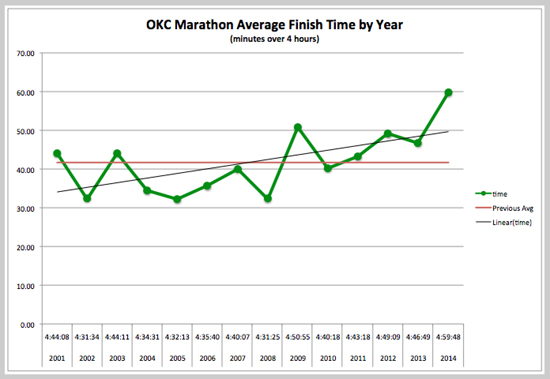
If one plots the percentage of finishers in each half hour slot for every year of the race (and T3 is just the one to do this) you find an expected bell curve with some deviation year to year. The curve for this year is shifted significantly to the right indicating that it took everyone longer to finish. To support that, one can also plot the average finish times for all 14 years (again, one did) and the same thing shows up: the longest average finish time by a wide margin occurred this year.
Turns out it was a bad day for everyone. However, even the worst day running a marathon is a blessing.